


A small Cloudflare Worker that gives you real-time site analytics without Google Analytics, cookies, or third-party scripts. Live demo: stats.zakk.au.
Why this Worker?#
- No cookies. Visitor IPs are SHA-256 hashed and truncated before storage.
- Free tier friendly. Most personal sites fit within Cloudflare's free quotas.
- Edge-native. Runs on Workers + KV, served from Cloudflare's global network.
- Multi-language aware. Normalises path variants across language versions.
- API + dashboard in one Worker. No separate frontend hosting needed.
What you get#
Real-time stats
- Today's PV/UV with live updates
- 7 / 14 / 30 day trend history
- Top 10 most-visited pages
Dashboard
- Dark / light mode
- Responsive layout for desktop and mobile
- English / Chinese UI
- Served from your own subdomain (e.g.
stats.example.com)
API
- REST endpoints for custom integrations
- Batch endpoints for efficient queries
- Health check for monitoring
Quick deployment#
Requirements: Node.js ≥ 18, wrangler CLI ≥ 3.0.
Clone the repository
git clone https://github.com/Zakkaus/cloudflare-stats-worker.git
cd cloudflare-stats-worker
Install Wrangler and log in
npm install -g wrangler
wrangler login
Create the KV namespace
wrangler kv namespace create PAGE_STATS
wrangler kv namespace create PAGE_STATS --preview
Paste the returned IDs into
wrangler.toml.(Optional) Enable D1 for trends and top pages
wrangler d1 create cloudflare-stats-top
wrangler d1 execute cloudflare-stats-top --file=schema.sql --remote
Uncomment the
d1_databasessection inwrangler.tomland fill in the IDs.Deploy
wrangler deployOpen the dashboard
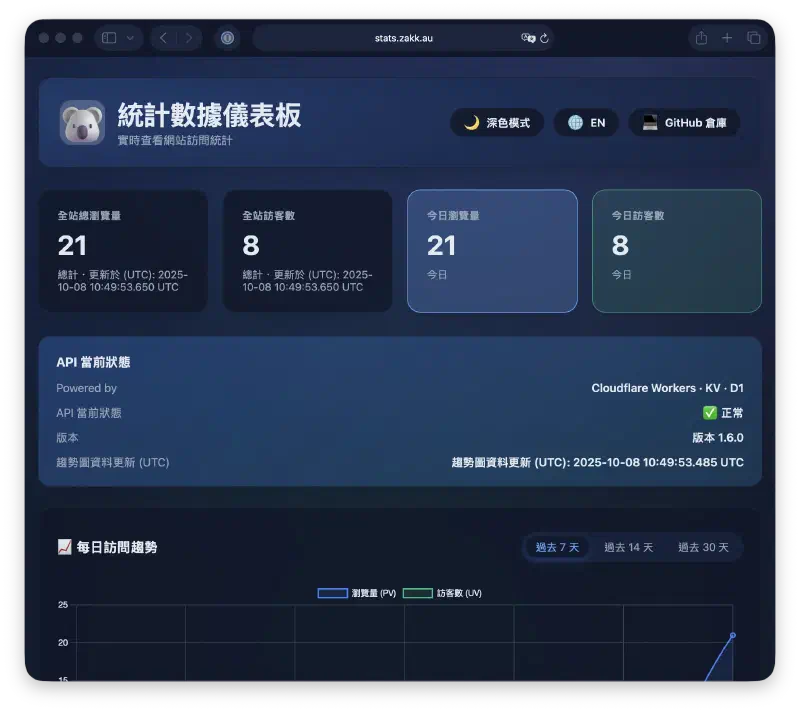
https://stats.example.com/You'll get the same view as stats.zakk.au:
- Today's PV/UV cards
- API health indicator
- 7 / 14 / 30 day trend charts
- Top pages ranking
- Theme toggle (dark/light)
- Language toggle (English/Chinese)
The dashboard is standalone — no embed needed, just share the URL.
Pricing: Free Tier vs Paid Plans#
Workers#
| Plan | Price | Included Requests | CPU Time | Overage Pricing |
|---|---|---|---|---|
| Free | $0 | 100k requests/day | 10ms/request | N/A (hard limit) |
| Paid | $5/month | 10M requests/month | 50ms/request | $0.50 per additional 1M requests |
KV (Key-Value Storage)#
| Plan | Price | Reads | Writes/Deletes/Lists | Storage | Overage Pricing |
|---|---|---|---|---|---|
| Free | $0 | 100k/day | 1k/day each | 1 GB | N/A (hard limit) |
| Paid | Included in Workers Paid ($5/mo) | 10M/month | 1M/month each | 1 GB | • Reads: $0.50 per 10M • Writes: $5 per 1M • Storage: $0.50 per GB/month |
D1 (Serverless SQL Database)#
| Plan | Price | Rows Read | Rows Written | Storage | Overage Pricing |
|---|---|---|---|---|---|
| Free | $0 | 5M rows/day | 100k rows/day | 500 MB | N/A (hard limit) |
| Paid | $5/month | 25B rows/month | 50M rows/month | 5 GB | • Reads: $0.001 per 1M rows • Writes: $1 per 1M rows • Storage: $0.75 per GB/month |
Pay-As-You-Go Option#
Even without subscribing to paid plans, you can enable pay-as-you-go billing to avoid hard limits:
- Workers: $0.50 per 1M requests beyond free tier
- KV: Individual operation pricing as listed above
- D1: Individual operation pricing as listed above
Which plan fits#
- Small personal blog (< 10k visitors/day): free tier is enough.
- Medium blog (10k–50k visitors/day): Workers Paid ($5/month).
- High-traffic site (> 50k visitors/day): Workers Paid + pay-as-you-go for KV/D1.
D1 is optional. If you only need real-time PV/UV counts, KV alone is sufficient and the dashboard still works (without the Top 10 trends).
API Endpoints#
Once deployed, you can access these endpoints:
# Health check
curl https://stats.example.com/health

# Page view count
curl "https://stats.example.com/api/count?url=/posts/example/"

# Overall statistics
curl https://stats.example.com/api/stats

# Daily trends
curl https://stats.example.com/api/dailyArchitecture#
Browser → Worker (stats.example.com)
          ├── /api/*     → Statistics API
          ├── /*         → Dashboard Static Files
└── Storage → Cloudflare KVFAQ#
Why not use Google Analytics? Self-hosted gives you full data control, no cookies, and avoids ad-blocker breakage.
Can I customise the dashboard?
Yes. The dashboard source lives in dashboard/ — edit the HTML/CSS/JS as needed.
How do I back up data? Use the provided backup scripts to export KV data to R2 or GitHub on a schedule.
This is the same stack powering stats.zakk.au. After deploy you have:
- A standalone analytics dashboard on your own subdomain
- A complete REST API for statistics
- Cookie-free, privacy-respecting tracking
Questions or issues: GitHub Issues.